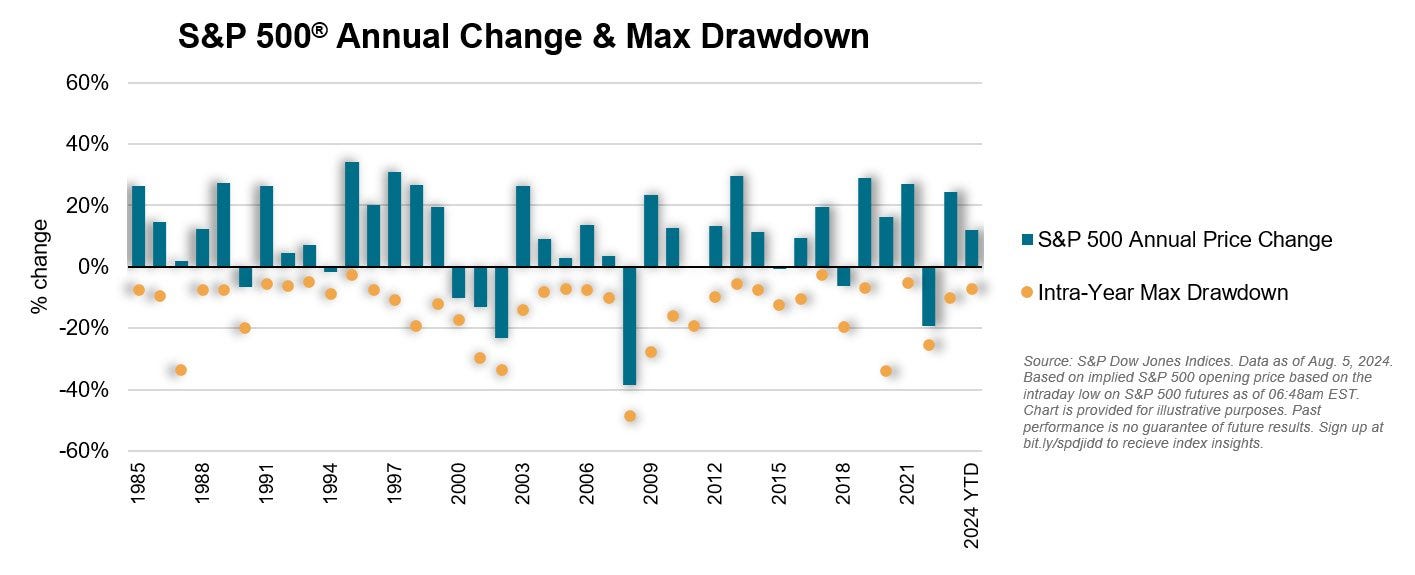
Schwab, Goldman and a few other investment banks have all started putting on charts about what the vix needs to hit to be considered a ‘washout’ and what the average S&P 500 drawdown during each year, and pretty much any other topic to kinda sorta state that we’re close to a bottom and you should buy.
The above chart is from Schwab, and I find it intere…
Keep reading with a 7-day free trial
Subscribe to Sleepysol’s Newsletter to keep reading this post and get 7 days of free access to the full post archives.


